
I think it is time for me to provide some explanation about the test harness built around the DeepTrainer library. DeepTrainer in itself is only a C++ library with a .NET wrapper, and these test harness applications are demonstrating their usage.
I’ve had various enquiries about the library recently, so I thought it is much easier to discuss potential cooperation with others if I provide at least a release build of the harness, and if I explain how you could use this test harness. Here you can download the latest release with all included dlls:
https://github.com/bulyaki/DeepTrainer/tree/master/Releases
This build makes use of the AvalonDock WPF library, I have recently worked on a project that made use of docking windows, and I found the design very pretty. AvalonDock achieves similar docking structure but in WPF. Also I am making use of the library OxyPlot and Extended WPF Toolkit.
After starting the NNTrainerTesterWPF.exe application, you are greeted with the main window:
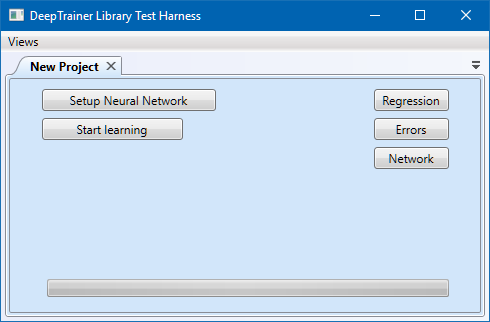
First click on the “Setup Neural Network” button, which will take you to the settings window:
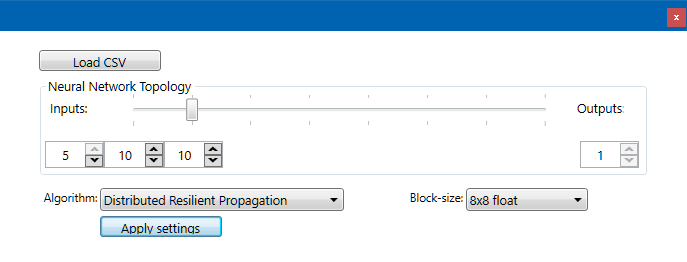
Click on “Load CSV”, then select a CSV file that contains the training patterns.
After this adjust the number of inputs and outputs, and use the slider to set the number of hidden layers. For every layer an input box appears, where you can set the number of neurons in each layer (default is 10, maximum is 100). Then select the desired training algorithm and the desired matrix block size (please read my previous article that explains the block sizes). Now you can click on “Apply Settings” which will take you back to the main window.
Here I would suggest you to open all three information windows BEFORE you start the training process! The training is very highly computationally intensive, so during training your computer will struggle updating the UI! Also, since the new windows are opening in new tabs, I would suggest you to undock them, and make them bigger, somehow like this:
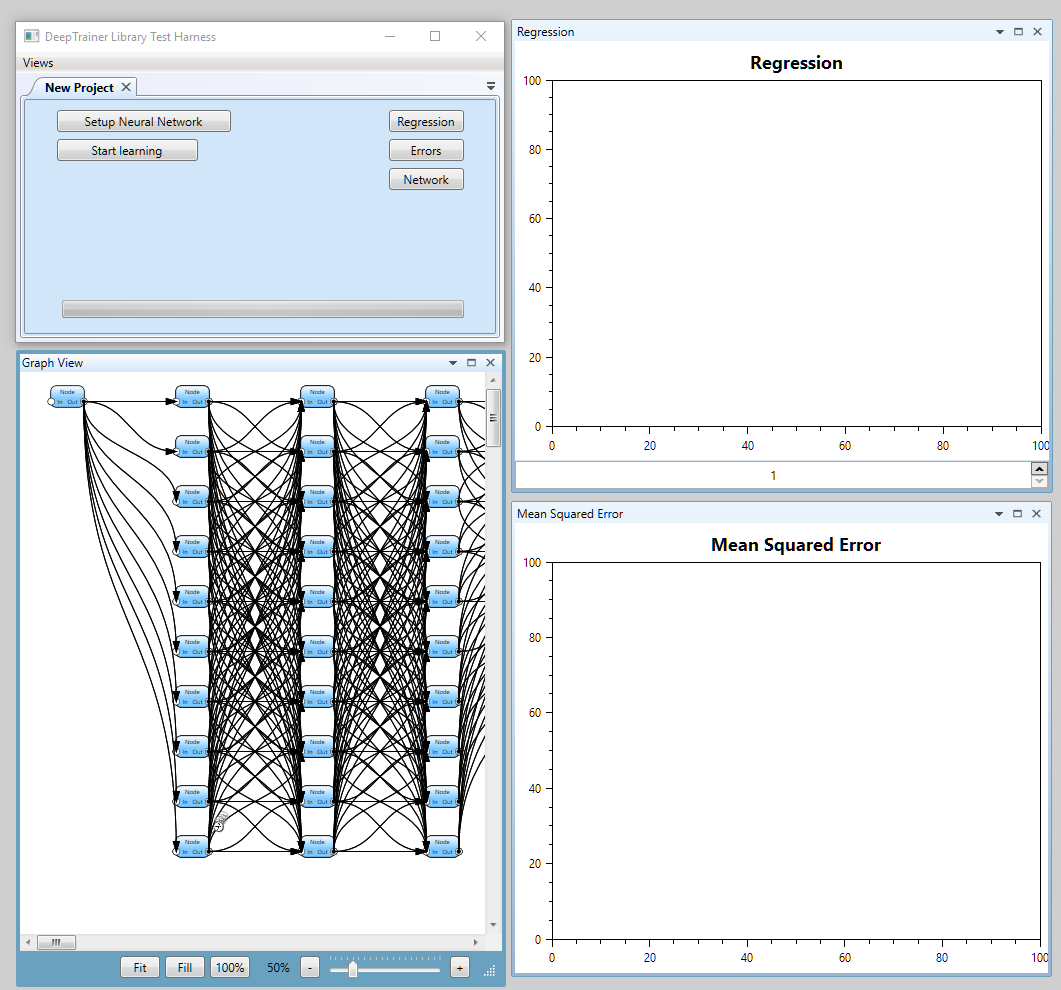
Now you can click on the Start Learning button, and here is what you should expect:
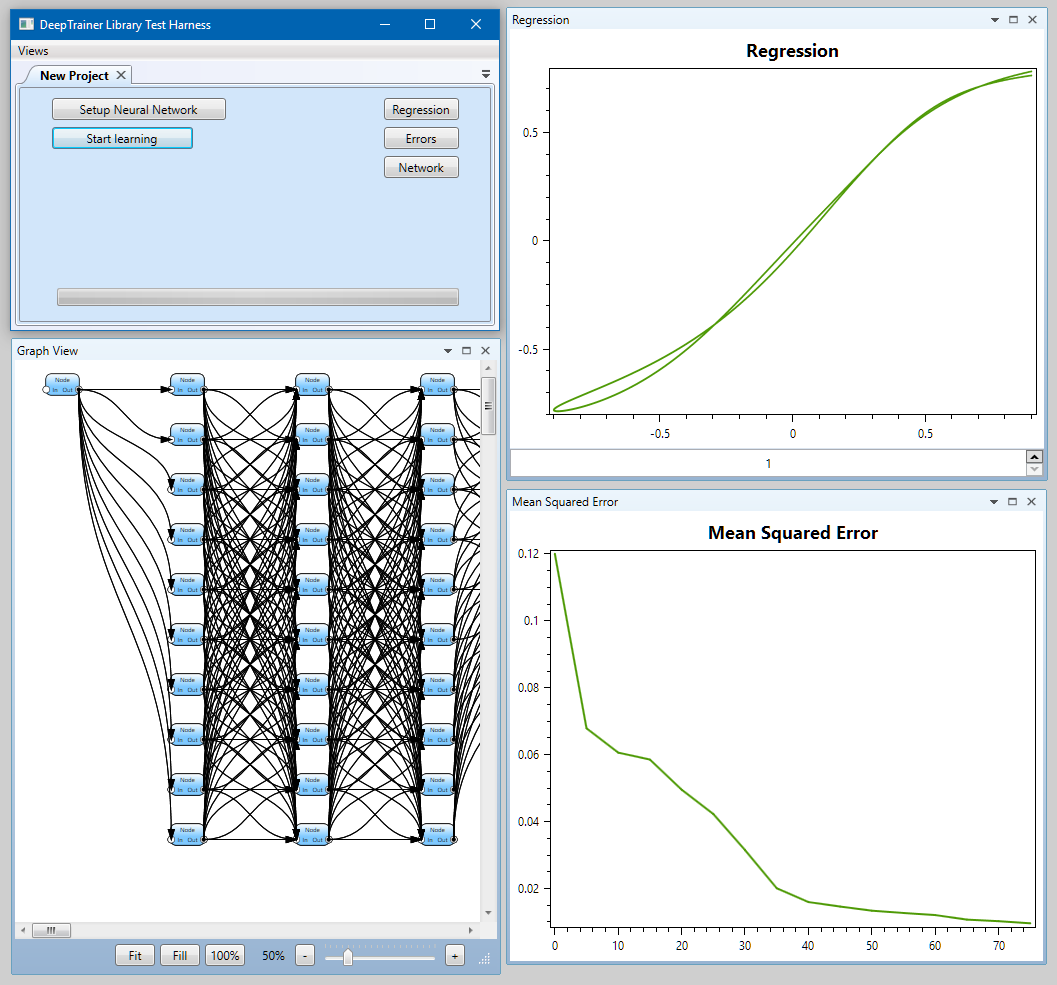
- The Mean Squared Error (or deviation) window displays the error of the outputs compared to the target values.
- The Regression window displays the output values in the function of the target values. It is called regression because I am planning to add a linear regression overlay to it, which is going to show how much the outputs are different from the targets. Regions in the training set that have more frequent values can heavily alter the angle of this regression, which is supposed to be a 45 degree line in an ideal case. You can change which output is displayed at the bottom of the window.
- The Graph View is just a nice addition to the UI, it really does nothing useful at the moment besides displaying the network graphically. Of course I have big plans to make this visualization show relevant information later on. I am also planning to use this graph view in the setup dialog for designing a network, allowing to tweak parameters, etc.
For the graph view I am reusing the work of Ashley Davis, who published an excellent article about his NetworkView library. I have integrated his library into the source code. Great thanks to Ashley for this gem, it saved me a lot of time that I didn’t have to reimplement this!
A minor comment: the test harness is still missing a stop/pause training button, and at the moment I haven’t put any effort into letting you save and load neural network. The C++ library is able to do this, but it is not implemented in the test harness. I have been concentrating on different parts recently, mainly on performance improvements, etc, so these essential bits were not included.