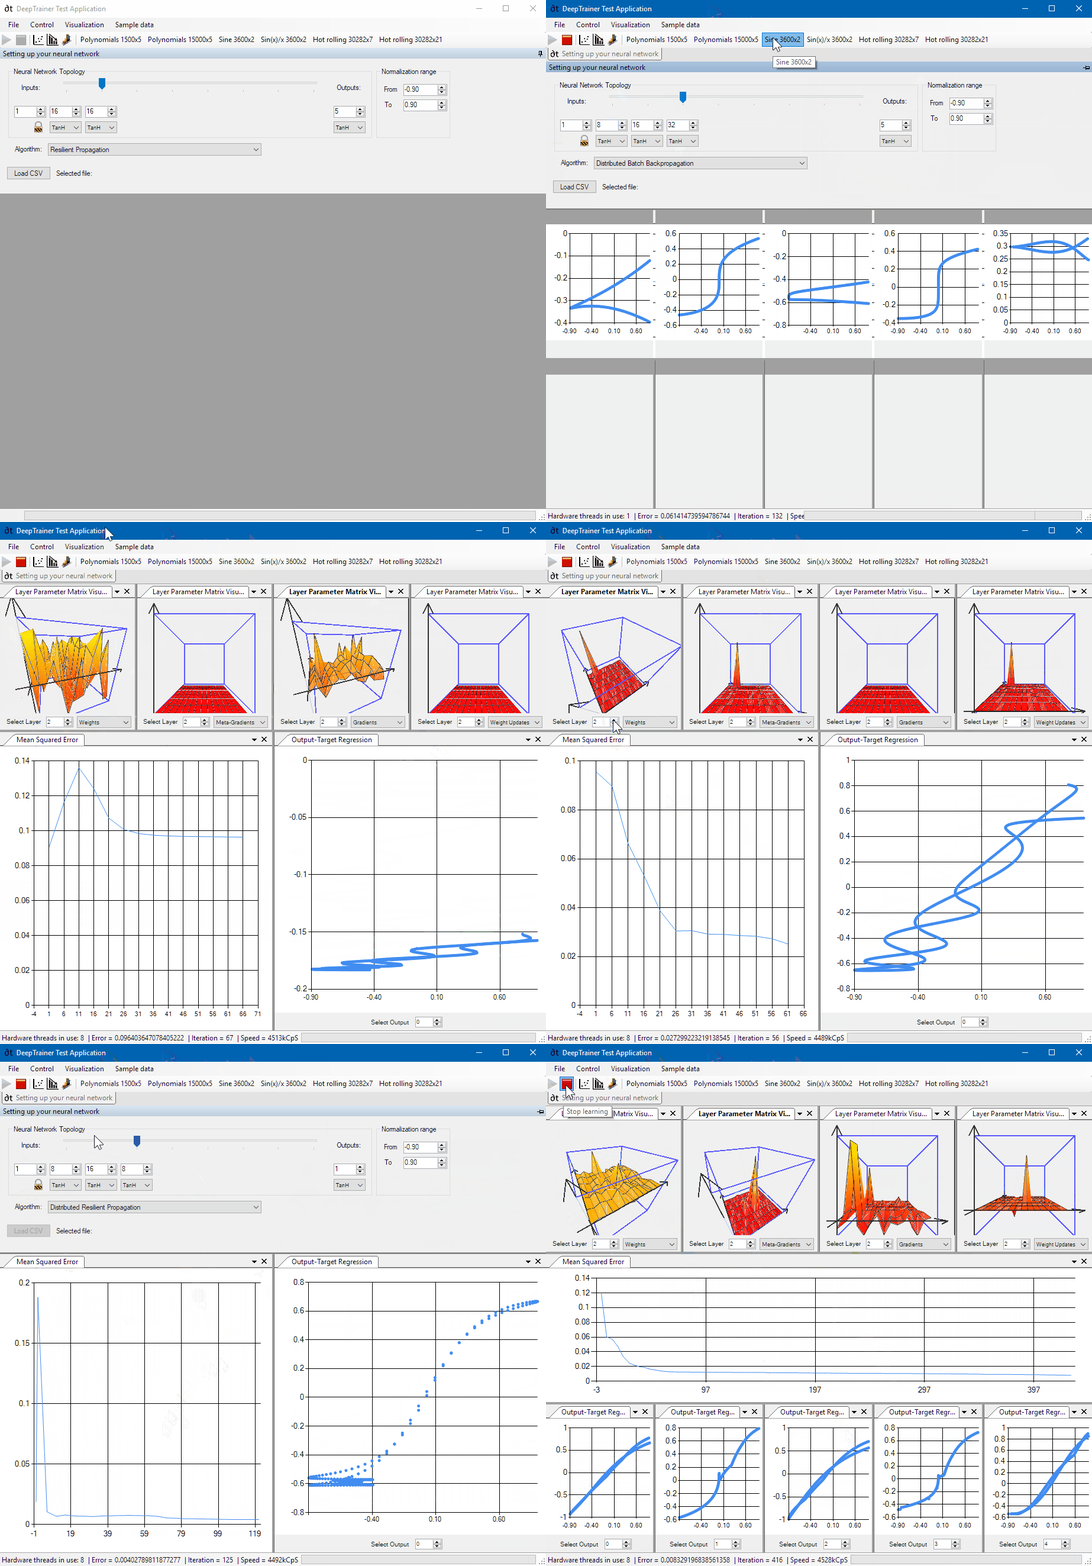
Recently I have been putting a lot of effort into the WinForms test harness application, mainly because it was very user unfriendly. It was missing essential controls even to adjust the number of inputs and outputs of a network, you had to change everything in the code yourself to make it working.
With these latest updates I may have overshot the target a little bit, because I did not only want to create a usable test harness, I wanted it to be in every possible ways better or at least as good as the application I created for my MSc final thesis. About 15 years ago my simple neural network application already had special 3D graphs that were displaying the internal states of the parameter matrices of the network real time, showing how their values were changing while the network was learning the target patterns.
On top of these, I have implemented it with a docking framework that allows you to create as many data visualization graphs as you want, in case you would like to investigate for example how the weight updates behave in the presence of certain activation functions.
Finally I have a Neural Network Settings window as well that allows you to adjust most parameters of the neural network: number of layers, number of neurons in each layer, types of activation functions on each layer, normalization range for the input data, and of course the type of the algorithm.
Also I have included some of my most used data samples in the application, and you can start using them just by clicking on a button. Then the application loads the CSV data, sets the number of inputs and outputs, picks up the neural network that is currently in the Settings window, and starts the training process. Also it immediately creates you target-output regression charts one for each output – docked to the bottom of the application. In the middle the errors graph window is docked. On top of them, it opens four 3D data visualization graphs each of which is displaying a different parameter matrix: Weights, Weight Updates, Gradients, Meta-Gradients*.

Besides the built in sample data of course it allows you to load your own arbitrary data set as well.
The 3D graphs are using OpenGL through the open source library called SharpGL. It was quite straightforward to port my old OpenGL code to it, and I am planning to use it for other types of visualization in the future.
*Meta-gradients are used in the Resilient propagation algorithm as an internal indicator of the steepness of the error surface, that is calculated independently from the original derivative value.
